New to my buy list for April 2024 is Hammond Power Solutions (HPS.A.TO). This pick is a speculative play. While Hammond Power is a small-cap company it might be the underdog investors didn’t see coming. It’s an interesting play with a good dividend if one is not afraid of market fluctuations. Hammond is still experiencing significant growth.
See also our U.S. buy list stock pick for this month.
Get great stock ideas from our Rock Stars list.
Hammond Power Solutions Business Model
Hammond Power Solutions Inc. is a manufacturer of dry-type transformers in North America. It engineers and manufactures a range of standard and custom transformers that are exported in electrical equipment and systems. It enables electrification through its range of dry-type transformers, power quality products, and related magnetics. Its standard and custom-designed products are essential and ubiquitous in electrical distribution networks through a range of end-user applications.
The company’s products include power transformers, furnace transformers, converter transformers, unitized substations, control & automation products, low voltage distribution products, medium voltage distribution products, and others. It supports industries, such as oil and gas, mining, steel, waste and water treatment, commercial construction, data centers, and wind power generation. It has manufacturing plants in Canada, the United States, Mexico, and India and sells its products around the globe.
HPS.A.TO Investment Thesis
Hammond Power is a small-cap company with a market cap of approximately $950M that competes against many giants in the industrial field. The company enjoys a solid reputation for the quality and reliability of its. HPS tried to expand its ![]() success internationally but had to close its Italian division and continues to struggle in India. However, after closing its Italian business, the company focused on what’s working for it in North America.
success internationally but had to close its Italian division and continues to struggle in India. However, after closing its Italian business, the company focused on what’s working for it in North America.
The company is now well-positioned in Mexico and exhibits growth potential in both Mexico and the U.S., which now represent more than 50% of its total revenue. Hammond continues to witness significant growth in its custom business in the energy, mining, silica chip manufacturing, and data center markets.
HPS.A.TO Last Quarter and Recent Activities
Hammond Power Solutions 2023 results showed robust growth across all geographies and channels. Its most recent quarterly results were strong, again, with revenue up 30% and EPS up 10%. The quarter ended with record shipments of $187M globally. This was a new record top line, which helped the company reach its margin and profit targets.
U.S. and Mexico sales were helped by a stronger U.S. dollar relative to the Canadian dollar compared to 2022. HPS saw substantial sales growth in the OEM channel in the U.S. in support of data centers, warehousing, industrial manufacturing, mining, electric vehicle charging, renewable energy, and oil and gas production. The company will continue to invest in increasing its capacity for 2025. This is looking good!
Potential Risks for Hammond Power Solutions
The pandemic had an impact on HPS as revenues decreased due to the deferment of electrical projects, business interruptions, and overall lower levels of economic activity. However, HPS proved its resilient business model, with orders rebounding and HPS skyrocketing.
We advise you to tread carefully with small caps that are growing too quickly. HPS’ expansion success in North America couldn’t be replicated in India or Italy. After closing its business in Italy, future expansion projects may not spark investors’ enthusiasm. Also, a part of the company’s revenue is tied to the oil & gas and mining industries, both of which are highly cyclical. HPS is also subject to currency fluctuations due to its exposure to the U.S. and Mexican markets. With such a small capitalization, an investment in this company can fluctuate frequently.
Want more ideas? Get our Rock Stars list, updated monthly.
HPS.A.TO Dividend Growth Perspective
HPS finally resumed its dividend growth policy in 2022 with a generous increase. The dividend went from $0.085/share to $0.10/share (+17.6% increase!) and then to $0.125 (+25%!) in early 2023. However, remember that the company chose to cut its distribution following the financial crisis of 2009, with more cuts in 2011-2012. The dividend remained stable for several years before the recent increases.
Unfortunately, the dividend growth policy will follow industrial economic cycles. In the meantime, you can enjoy the ride! Speaking of which, management increased HPS’s dividend by another 20% in September 2023.
Final Thoughts on Hammond Power Solutions (HPS.A.TO)
Hammond Power Solutions has shown amazing growth for the last two years. With a recession possibly around the corner, its customers in cyclical industries might not do very well themselves. Is HPS resilient enough to keep that growth going or will headwinds slow it down? Only time will tell.
Obviously, you don’t bet the house on this, but it could be a very lucrative investment, as long as you can live with significant volatility.
 Dividend reinvestment plans (DRIPs) are an investment tool that allows shareholders to reinvest cash dividends received from a company’s stock into more
 Participating in a DRIP increases investors’ positions in some stocks automatically without them having to lift a finger. Over time, you could end up with overweight positions for these stocks if you don’t monitor your portfolio.
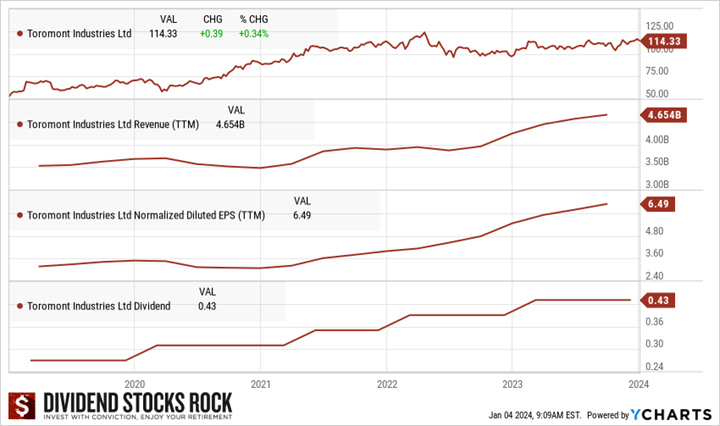
 Toromont Industries is a Canada-based company serving the specialized equipment and lifetime product support needs of thousands of customers in diverse industries from roadbuilding to mining, and telecommunications to food and beverage processing. It operates the Equipment Group and CIMCO segments.