How about dividend ETFs? I’ve been asked this question often during webinars. ETFs are useful due to their offering the investor immediate diversification along with minimal fees. To be honest, it’s the perfect solution for anyone who doesn’t want to put the time and energy into managing their portfolio and selecting their stocks.
However, in most cases, this also means you are likely to be leaving money on the table. Dividend ETFs could be too diversified. Having over 100 dividend stocks may hurt total return. I found out that investing in a small number of stocks brings better results.
I haven’t yet found a dividend ETF that shows only companies that I would like to invest in. If I look at the top holdings for XDV.TO for example, its largest holding is CIBC (CM.TO). While Canadian banks are great, CIBC ranks #5 in my Canadian Banks Ranking. The other thing I dislike is that they count all 6 banks in their top 10, which may lead one to believe they haven’t heard of the concept of diversification.
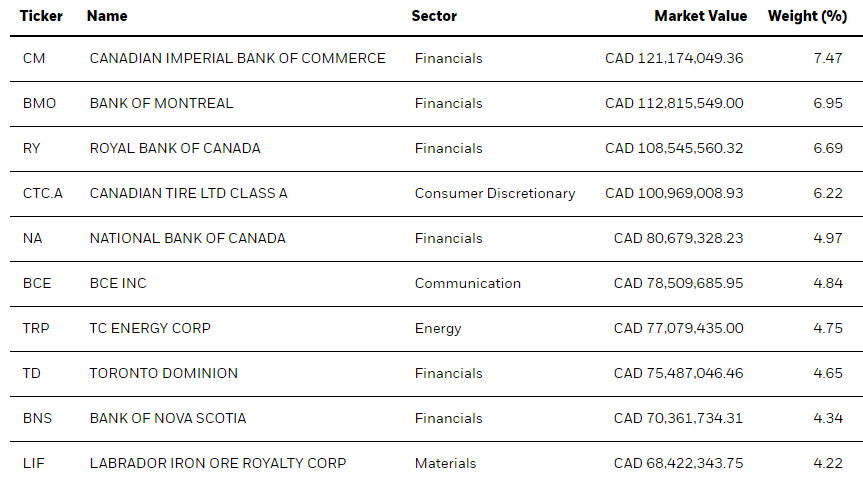
source: BlackRock iShares Canadian Select Dividend Index ETF
To get back to the question: are dividend-paying ETFs worth it? If you don’t have the time, knowledge or interest to manage your portfolio, ETFs could be a good strategy. Selecting individual stocks will help you reach your goals faster and stay closer to your investing values.
However, that doesn’t mean ETFs can’t coexist with individual stocks in your portfolio.
What Could be Really Worth it?
I can see several reasons why an investor would consider ETF investing. Here are a few good examples.
Benchmark
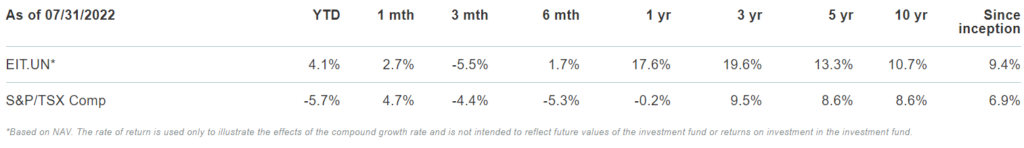
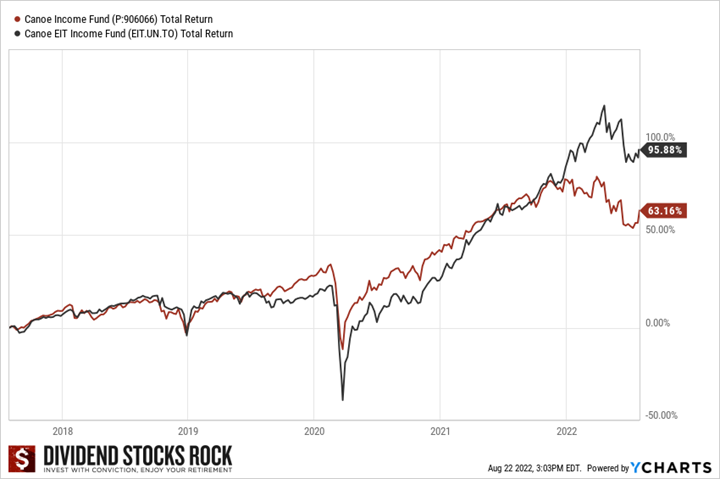
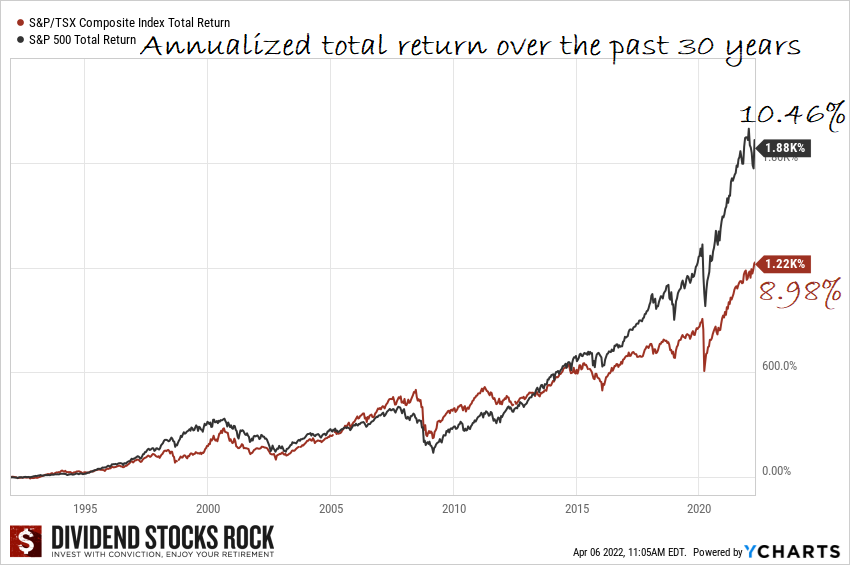
Since the beginning of DSR, we have been using VIG and XDV.TO as our benchmarks. The point of using benchmarking is to assess our strategy vs. an existing alternative solution. Why would I spend time managing my portfolio if I could quickly buy an ETF and make the same money? It only makes sense if I can do better than existing investing solutions.
The problem with benchmarking is we often become too focused on short term results. One must know that looking at any performance records under three years is pure noise. It starts to be meaningful after five years and is very meaningful once you have gone through a full economic cycle.
Start investing
Many asked me how I started my RESP, the account used in Canada to pay for childrens’ college tuitions. I started this account a long time ago with just a couple of hundred dollars. It was not enough to build a portfolio and the monthly systematic investment plan would add a lot of complexity if I had to pick a different stock each time. Therefore, for the first few years, I invested all that money in ETFs until I built a value above $10,000. I then switched this portfolio to the DSR investing methodology focusing on dividend growers.
As a first step in the investment world, ETFs will provide you professional support (ETFs are built and managed by experienced industry professionals), instant diversification (invest in 50-100 securities with a single trade), and peace of mind (no need to manage the ETFs composition). Therefore, it’s the perfect vehicle to use to start a new portfolio. I’m currently showing this same strategy to my two teenagers (and soon to my 10yr old son).
Diversification
While I wouldn’t use ETFs to replace any of my individual stocks, you might improve your portfolio diversification by using them for other asset classes. You can invest in fixed income products such as bonds and preferred shares (we have over 80 bond ETFs and 18 preferred share ETFs in our screener). You could also invest in commodities, emerging markets, or cryptocurrencies through ETFs.
Searching by theme using the search box of our screener, you can rapidly find viable options to add to your portfolio. This additional diversification may help to reduce volatility (bonds / preferred shares), protect your portfolio against inflation (commodities) or hopefully improve the upside potential. Those assets won’t necessarily generate dividends, but they can bring something else to your portfolio.
Exposure to a sector without the work
It could also be a good strategy if you want to gain exposure to a specific industry that you don’t fully grasp. I’ve expressed my interest for the technology sector in the past. Some investors may be intimidated by new technologies and wouldn’t be comfortable analysing growth opportunities in this sector. Some others might have a hard time understanding big pharma’s pipeline development and patents while others might be lost trying to understand how life insurance companies work. Many times, Canadian investors have told me they were good at selecting Canadian stocks but would rather use ETFs to gain exposure to the U.S. markets.
If you aren’t comfortable with investing in a specific sector or market, you can use ETFs. You would benefit from an ETFs best quality (diversified, cheap and professionally managed).
Build a core portfolio
Finally, ETFs could be a good tool to build a core portfolio and then add some spice with individual stocks. Think of investing as cooking a good meal. You can use ETFs as your “core soup” while you make necessary adjustments with different spices by using individual stocks. A 50% ETF and 50% stock portfolio might bring you the peace of mind you may be looking for while you keep control of a good part of your money.
How to Select Your ETFS
As is the case with any investment products, ETFs may track the same asset or follow the same investing strategy, but they are not created equal. There are a few things you must consider before making your decisions.
Financial metrics
In the DSR ETF screener, you will find a good list of metrics to analyze ETFs. The year to date, 1yr, 3yr and 5yr returns will tell you much about the performance of the ETF. It is then easier to know what to expect from this product and make comparisons.
The expense ratio is also very important since you can then pick the cheapest (and hopefully best performing) ETF for a specific sector. If you can’t decide between two similar ETFs, pick the one with the cheapest fees. It is likely the one that will have the best chance of performing well in the future.
Volume and assets under management (AUM) will tell you more about the liquidity and the size of the ETF. It’s important to invest in assets that are liquid. You also want to avoid the latest flavor of the month.
The historical spread will also give you an idea on the ETF’s volatility (the wider the spread, the higher volatility). This could have a big impact on price fluctuations during a market crisis. We saw how some preferred shares and bond ETFs plummeted in March of 2020.
The discount/premium to NAV (net asset value) will tell you if you are paying more than what the ETF is worth or if you are getting a bargain. In general, you want this number to be as close to zero as possible in order to buy at the right price.
ETF analysis
While you can easily make your selection based on basic metrics, but if you want exposure to commodities, or bonds, you must perform a few additional checks if you want an ETF that includes equities.
Once you have selected a pack of ETF that might work with your portfolio, you still have some work to do. The ETF analysis must include the comprehension of the investment strategy. You can usually find this information from the ETF manufacturer (the financial firm managing and selling the ETF). Here’s an example from VIG:
“The investment seeks to track the performance of the S&P U.S. Dividend Growers Index that measures the investment return of common stocks of companies that have a record of increasing dividends over time. The adviser employs an indexing investment approach designed to track the performance of the index, which consists of common stocks of companies that have a record of increasing dividends over time. The adviser attempts to replicate the target index by investing all, or substantially all, of its assets in the stocks that make up the index, holding each stock in approximately the same proportion as its weighting in the index.”
Some are obviously more complicated or opaque than others. Here’s ZWB.TO, a covered call ETF:
“BMO Covered Call Canadian Banks ETF seeks to provide exposure to the performance of a portfolio of Canadian banks to generate income and to provide long-term capital appreciation while mitigating downside risk through the use of covered call options.”
You know they will use covered call options. Unfortunately, you won’t know much about how their option writing process works with this information. If you are curious, you can also read more in the ETF prospectus also found on the company’s ETF website.
The second step is to check the ETF’s top holdings. It will quickly determine if this ETF could fit in my portfolio or not. By looking at the top 10 holdings, you will see what drives this investment. If you cringe on one or two company names, you might want to skip this one and select an alternative ETF.
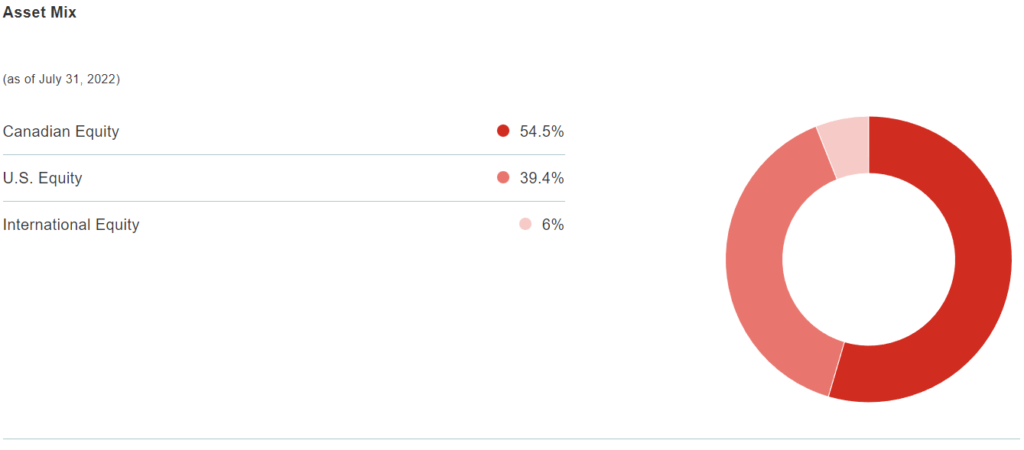
The third step will require you to look at the ETF sector allocation. At DSR, we are currently able to give you the ETF sector if it’s a single sector ETF, but we can’t ventilate several sectors. To do that, you must go to the ETF’s website and look at the graph provided by the financial firm. Looking at how the ETF is invested throughout various sectors will allow you to better predict the impact on your portfolio’s volatility and upside/downside potential. This extra step requires more calculations, but it is crucial for you to include your ETFs allocation in your portfolio.
Finally, I wouldn’t over complicate things when it comes down to ETF investing. ETFs have been created to be efficient and simple to understand. Once you have selected the asset exposure you desire, look at a few financial metrics. Then, confirm your choice by looking at what’s inside the hood. Don’t attempt to track each ETF movement and change in allocation. You may spend as much time as you would have if you selected individual stocks. The power of ETF investing resides in the simplification of your strategy. Therefore, adding a dozen ETFs doesn’t necessarily improves your portfolio quality or simplicity.
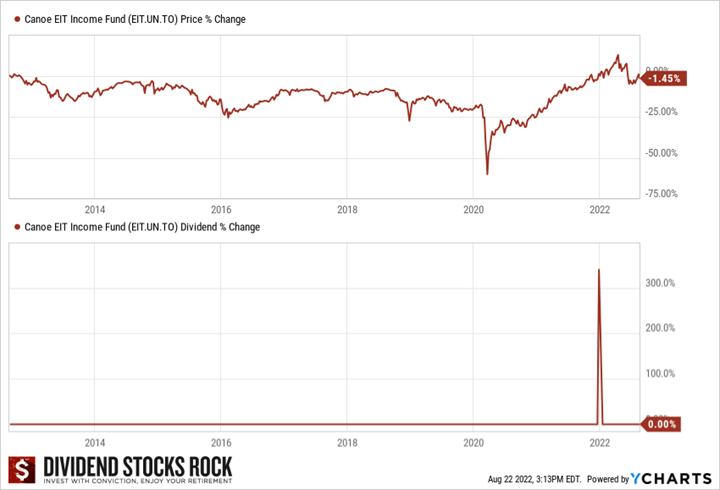
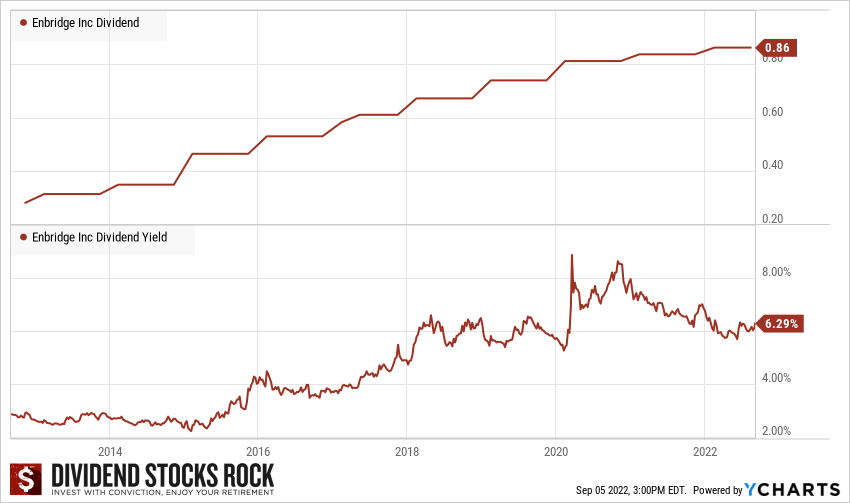
Warning: Canadian Dividend ETFs’ Dividends Aren’t Stable
You read right: dividend ETFs don’t pay a stable dividend. It creates lots of confusion and frustration among investors! Let’s take a look at how the iShares Canadian Select Dividend ETF (XDV.TO) rewarded its investors.
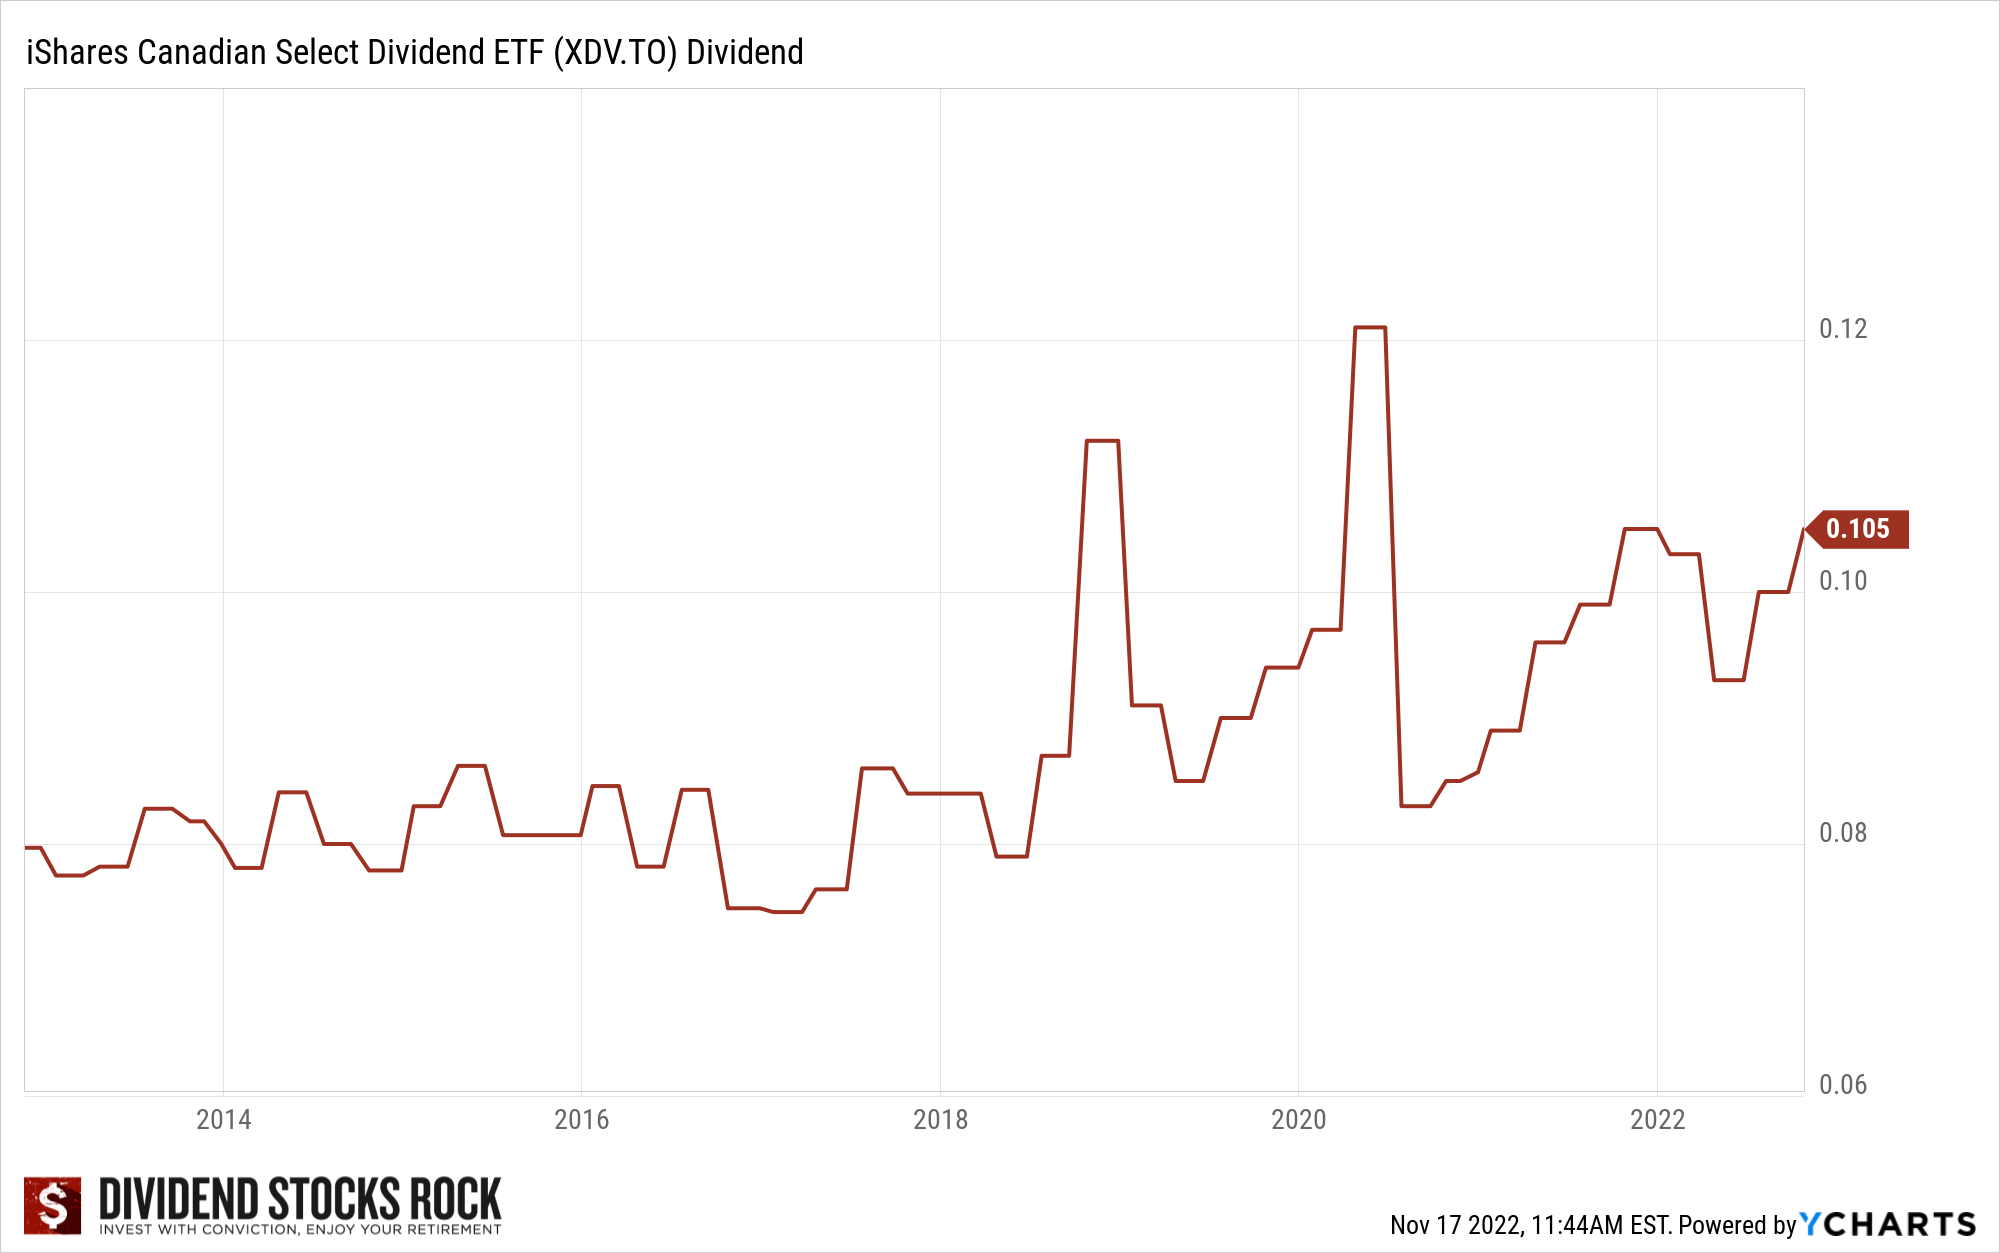
Dividend ETFs will receive dividends from the company they invest in. They may also reward investors with additional distributions generated by capital gains or other profits generated by the liquidity or other investment vehicles inside the ETFs.
As you can see in the previous graph, the dividend eventually goes up. Unfortunately, it will not be steady from quarter to quarter.
Final Thought
I am not considering investing in ETFs any time soon. However, I consider this product to be a great tool for investors. The fact that you can quickly diversify your portfolio at a ridiculously low price makes ETFs an investors friend. It’s the perfect fit if you want to invest in a sector but don’t want to do the extra research attached to stock picking.
If you are happy with individual stocks like I am, please do not feel the need to add ETFs to your portfolio. If your strategy is working already, there is no need to fix something that is not broken.
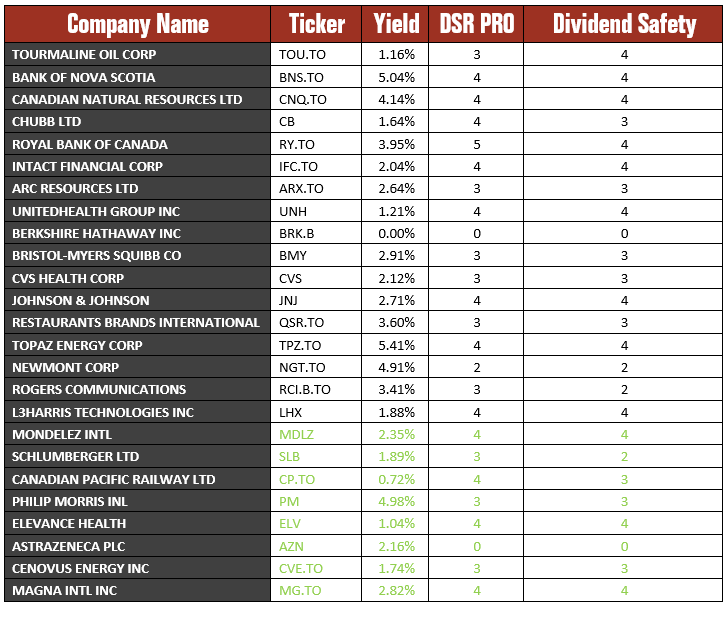
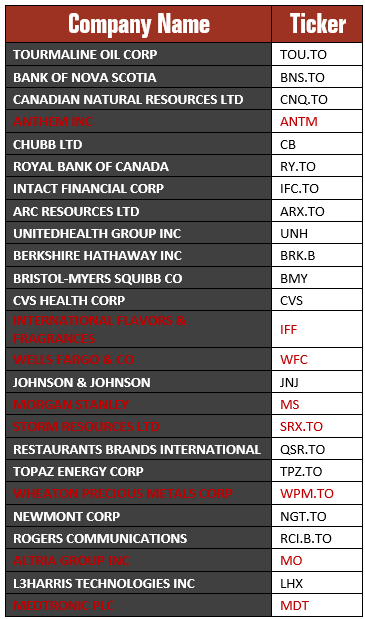
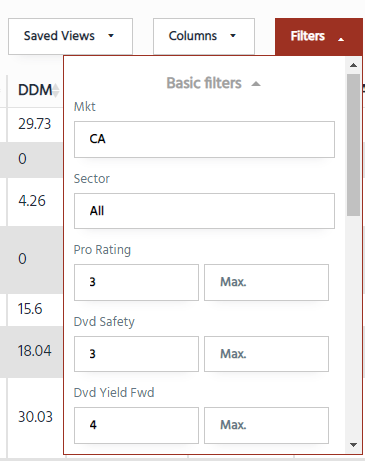 The first step in finding interesting stocks is to go to the Canadian Retirement portfolio and the 100% Canadian portfolio models’ pages and select companies with a minimum rating of 3 for both the DSR PRO rating and the Dividend Safety Score. I also added a minimum dividend yield of 4% as I want to make sure I can use the full 5%+ interest rate that will be charged on my loan by the end of the year. Right now, I’m at 5.4% on a variable rate. That helped me to select a few stocks, but it wasn’t enough to build a complete portfolio. I wanted to double-check across our entire stock library.
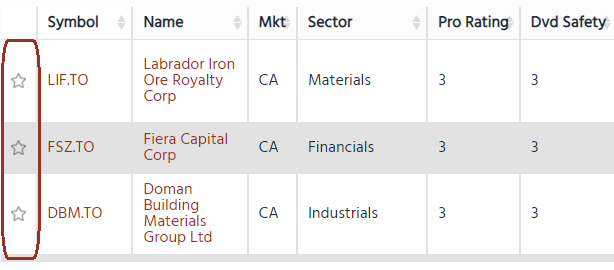
 While I love our stock screener, when you look at 30 financial metrics, it’s not that easy to see them and sort them as you want. Excel is a better software to use to make an additional triage among the list of your potential stocks. Then, I can read each stock card and start building my portfolio! Will I go ahead and buy the 22 stocks? Let’s build a fake portfolio to see what it looks like, shall we?